
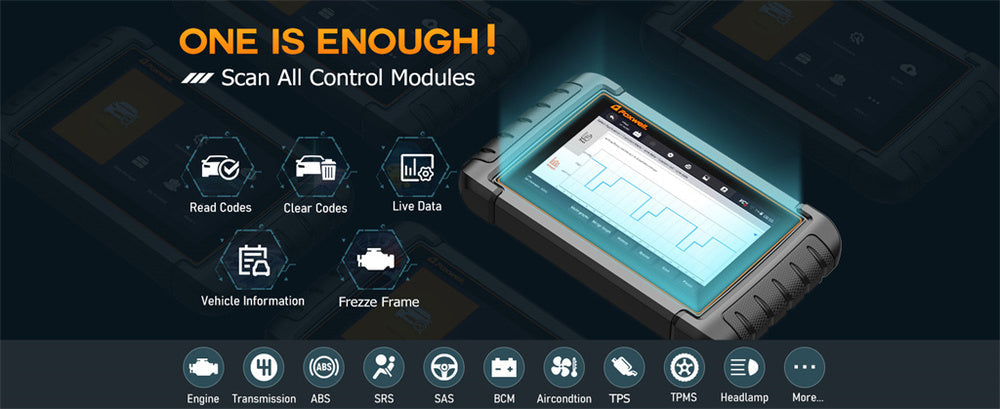
OBD2 scanners have become essential tools for vehicle diagnostics, offering real-time data from various systems and sensors that help identify potential issues before they become serious problems.
One of the most powerful features of modern OBD2 scanners is the ability to access live data. But what exactly is live data, and how can it be effectively used to diagnose and maintain your vehicle?
Here, we’ll break down the key types of live data, how to interpret them, and how they can be used to address common vehicle issues.
What is Live Data on an OBD2 Scanner?
Live data on an OBD2 scanner provides real-time information from various sensors and systems within your vehicle while it's operating.
It’s like having a health monitor for your car, continuously showing key metrics like engine RPM, oxygen sensor readings, and fuel trim values.
This feature allows you to assess your vehicle’s condition beyond just error codes, enabling earlier detection of potential problems.
Live data is critical for both diagnosing issues and optimizing performance, as it offers a clear view of how different systems in your vehicle are functioning in real time. However, the data displayed will vary depending on the vehicle's model and the sophistication of the OBD2 scanner.
Common Types of Live Data and What They Mean

Your OBD2 scanner will present a range of live data points, each offering valuable insights into how your vehicle is performing. Here are some of the most common types of live data and what they mean:
Engine RPM (Revolutions Per Minute)
Engine RPM indicates how fast your engine is running. High RPMs at idle could indicate an issue with the idle control system or a vacuum leak.
Fuel Trim (Short-Term and Long-Term)
Fuel trim data reflects the adjustments made to your engine’s air-fuel mixture. Positive fuel trim values suggest a lean condition, while negative values indicate a rich mixture. Persistent abnormalities may point to issues like air leaks or faulty fuel injectors.
Oxygen Sensor Readings
Oxygen sensors monitor the amount of oxygen in the exhaust. If readings are erratic, it could indicate a fuel mixture problem or a failing catalytic converter.
Coolant Temperature
The coolant temperature should generally remain between 190°F and 220°F (88°C to 104°C). Higher temperatures may indicate a cooling system problem, such as a failing thermostat or radiator issues.
Mass Air Flow (MAF) Sensor
The MAF sensor measures the amount of air entering the engine. A faulty reading can indicate a dirty or malfunctioning sensor, which can lead to performance issues or poor fuel efficiency.
Throttle Position Sensor (TPS)
The TPS shows how far the throttle is open, which controls the air entering the engine. If the data is erratic, you may experience issues like poor acceleration or stalling.
Battery Voltage
A healthy battery should show around 12.6V when the engine is off and 13.7V to 14.7V when running. Low voltage can indicate alternator or battery problems, while high voltage might point to a faulty voltage regulator.
Ignition Timing
Ignition timing data shows when the spark plugs fire relative to the position of the piston. Incorrect timing can lead to performance problems such as knocking or pinging.
Understanding these data points can help you monitor your car’s health, allowing you to catch issues before they escalate into serious problems.
OBD2 Live Data Abbreviations & Parameter List (Quick Reference Table)
When viewing live data on an OBD2 scanner, many parameters appear as abbreviations. Understanding these helps you quickly interpret what your vehicle is doing in real time.
Below is a categorized quick-reference table of the most common OBD2 live data parameters.
| Category | Abbreviation | Full Name | What It Tells You |
|---|---|---|---|
| Engine | RPM | Engine Revolutions Per Minute | Engine speed and load behavior |
| ECT | Engine Coolant Temperature | Engine thermal condition | |
| IAT | Intake Air Temperature | Air density affecting combustion | |
| Fuel System | STFT | Short-Term Fuel Trim | Immediate fuel adjustment |
| LTFT | Long-Term Fuel Trim | Long-term fuel correction trend | |
| FRP | Fuel Rail Pressure | Fuel delivery pressure | |
| Air Intake | MAF | Mass Air Flow | Air entering engine |
| MAP | Manifold Absolute Pressure | Engine load and intake pressure | |
| Ignition | IGN ADV | Ignition Advance | Spark timing behavior |
| MISF CNT | Misfire Count | Cylinder combustion stability | |
| Oxygen Sensors | O2S B1S1 | O2 Sensor Bank 1 Sensor 1 | Air-fuel mixture feedback |
| O2S B1S2 | Downstream O2 Sensor | Catalytic converter efficiency | |
| Throttle | TPS | Throttle Position Sensor | Throttle opening percentage |
| Emissions | EVAP | Evaporative System Status | Fuel vapor control system |
| Electrical | VSS | Vehicle Speed Sensor | Road speed input |
| BATT V | Battery Voltage | Charging system health | |
| Transmission | TFT | Transmission Fluid Temperature | Transmission fluid operating temp: High = stress/cooling/clutch issues; Low = poor shift quality. |
| Gear Cmd |
Current gear command |
Gear the TCM is commanding: Diagnoses shifting issues, slipping, or limp mode. |
This list helps you quickly identify which system a reading belongs to before deeper analysis.
Live Data by Vehicle System (Engine, Transmission, and More)
OBD2 live data becomes easier to understand when grouped by vehicle system, rather than just individual parameters.
| Vehicle System | Key PIDs to Monitor | Used to Diagnose |
|---|---|---|
| Engine System | RPM, STFT/LTFT, MAF/MAP, O2 Sensors, Ignition Timing, Coolant Temp | Rough idle, poor fuel economy, misfires, lean/rich fuel mixtures |
| Transmission System | TFT, Current Gear Command, Vehicle Speed vs RPM | Hard shifts, slipping, delayed engagement, transmission overheating |
| Brake & Stability | Wheel speed sensors, ABS status, Brake switch signal | ABS faults, traction control issues, wheel speed discrepancies (when supported) |
| Other Systems | EVAP status, Battery voltage, Intake air temp | Emissions issues, electrical system health |
How to Interpret OBD2 Live Data Like a Technician
Reading live data is not just about numbers — it's about understanding how sensors behave together under different conditions.
Interpreting live data from your OBD2 scanner starts with understanding the normal range of values for your vehicle. Compare the data your scanner shows with baseline values from your vehicle’s manual or reliable online sources.
It’s important to focus on patterns rather than isolated readings. For example, if your coolant temperature spikes only while idling, it could signal a cooling fan issue. Similarly, if fuel trim values are consistently high, it might indicate an air intake problem or fuel system issue.
Use freeze frame data whenever possible. This feature captures sensor readings when a trouble code is triggered, giving you a detailed snapshot of your vehicle’s state at the moment of failure, which is especially helpful for diagnosing intermittent problems.

How to Read Live Data on OBD2 Scanner
If you're new to live data, follow this simple process instead of watching random numbers.
Step 1 — Warm up the engine
Most readings are only meaningful when the engine reaches operating temperature.
Step 2 — Observe idle values
At idle, check:
- RPM stability
- Fuel trims
- Coolant temperature
- MAF readings
Idle is where many issues first appear.
Step 3 — Increase engine speed
Gently rev to 2500 RPM:
- O2 sensors should switch rapidly
- Fuel trim should stay within normal range
- MAF should rise smoothly
Step 4 — Compare related sensors
Never analyze one value alone.
Example:
- High RPM + low MAF = airflow measurement issue
- High fuel trim + normal MAF = possible vacuum leak
Step 5 — Watch behavior, not single numbers
Spikes, drops, delays, or unstable readings often reveal more than static values.
Normal vs Abnormal Live Data Readings (With Diagnostic Clues)
Seeing numbers is not enough — the key to live data interpretation is knowing what ranges are normal and what patterns indicate trouble.
| Parameter | Normal Reading | Abnormal Pattern | Possible Cause |
|---|---|---|---|
| Fuel Trim (STFT/LTFT) | -5% to +5% | Above +10% (lean) | Vacuum leak, weak fuel pressure |
| Below -10% (rich) | Leaking injectors, bad O2 sensor | ||
| O2 Sensor Voltage | Rapid switching 0.1–0.9V | Stuck high/low | Failed sensor or mixture problem |
| MAF at Idle | 2–7 g/s (4-cyl typical) | Very low/high | Dirty or failing MAF |
| Coolant Temp | 190–220°F (88–104°C) | Never warms up | Stuck-open thermostat |
| Over 230°F | Cooling system issue | ||
| Battery Voltage (Running) | 13.7–14.7V | Below 13V | Weak alternator |
| Above 15V | Bad voltage regulator | ||
| Ignition Timing | Stable advance | Large fluctuations | Knock, misfire, sensor issue |
| Misfire Data | 0 counts | Increasing counts |
Ignition coil, plug, injector issue |
These comparisons transform live data from numbers into diagnostic decisions.
Step-by-Step: Which Live Data to Check for Common Problems
Instead of guessing, use this structured approach to target issues with live data:
🚗 If the car has poor fuel economy
Check: STFT, LTFT, MAF, O2 sensors
Warning Signs:
- LTFT > +10% → Lean fuel mixture (not enough fuel relative to air)
- MAF reading unstable/fluctuates → Clogged air filter/air intake issue
🚗 If the engine is overheating
Check: Coolant temp (ECT), radiator fan status
Warning Signs:
- Temp rises at idle but drops when driving → Faulty radiator fan (not activating at idle)
- Temp climbs continuously (even while moving) →Failed thermostat/water pump
🚗 If the engine hesitates or misfires(intermittent performance issues)
Check: Misfire data(cylinder-specific count), ignition timing, fuel trim
Warning Signs:
- Misfire count rising on one cylinder → Bad spark plug or ignition coil
- Timing pulled back sharply → Engine knock or faulty knock sensor
🚗 If the Check Engine Light is on
Check: Live data related to the DTC system
Example:
- P0171 → look at fuel trim + MAF sensor first (don’t replace the O2 sensor immediately)
Do All OBD2 Scanners Show Live Data? What to Look For
Not every OBD2 scanner offers full live data access.
When choosing a scanner, check for:
- Ability to read Mode 01 live data
- Graphing capability (important for O2 sensors)
- Data logging and playback
- Number of supported PIDs
- Compatibility with your vehicle make
Basic code readers may only display DTCs, while advanced scan tools allow full sensor monitoring, which is essential for deeper diagnostics.
Real-World Example: When Standard Live Data Isn’t Enough
Many beginner drivers assume that if a scanner can show “live data,” it can monitor everything in the vehicle — but that’s not the case.
In one real-world scenario shared by a driver, a flashing check engine light appeared during a late-night drive, which typically signals a severe misfire.
A basic OBD2 scanner with live data would have shown misfire counters, fuel trim, and O2 sensor activity — enough to confirm an engine problem quickly.
While standard OBD2 live data would have helped diagnose engine misfires, it won’t provide insights into other critical systems like ABS, airbags, or transmission. That’s where OEM live data becomes necessary.
Standard OBD2 live data (Mode 01) mainly covers:
- Engine sensors
- Fuel system
- Emissions-related components
But OEM live data allows access to manufacturer-specific modules such as:
| System | OEM Data Insights |
|---|---|
| ABS | Individual wheel speed sensor data |
| Airbag (SRS) | Crash sensor and circuit status |
| Transmission | Shift solenoid commands, fluid temperature, gear engagement |
| Body modules | Door sensors, HVAC actuators, lighting control |
For example:
- An ABS light with no engine codes → OBD2 data shows nothing useful
- An airbag warning light → Requires OEM SRS data
- Harsh or delayed shifting → Transmission live data (not standard OBD2)
This distinction matters when choosing a scanner.
If your goal is check engine light diagnosis, standard OBD2 live data is usually enough.
If you want to troubleshoot safety systems, braking, or transmission behavior, a scanner with OEM system coverage becomes necessary.
Example: Viewing Live Data on a Foxwell OBD2 Scanner
On Foxwell OBD2 scanners such as the NT301, accessing live data is designed to be quick and practical — especially when you’re trying to understand whether a reading is normal or pointing to a real issue.
- Connect to the OBD2 port and power on the tool
- Select OBDII/EOBD → Live Data
- Choose either All Data Stream or select specific PIDs you want to monitor
- Switch to graph mode to watch how values change in real time
The NT301 supports full OBD2 service modes, so the same tool you use to read and clear codes can also monitor the live sensor data discussed in this guide — making it easier to move from “I have a code” to “I understand what the engine is actually doing.”
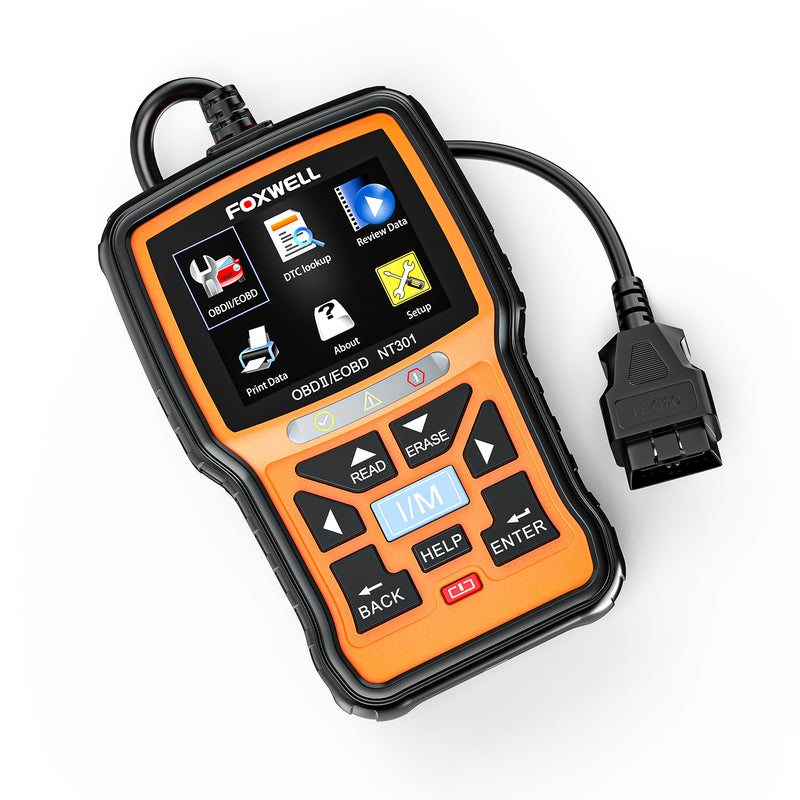
Foxwell NT301 OBD2 Scanner
Supports full OBD2 live data with graphing and freeze frame access, helping you spot abnormal sensor patterns instead of guessing from numbers alone.
View NT301 Live Data Scanner →Conclusion
Understanding live data from your OBD2 scanner gives you the upper hand in maintaining your vehicle's health.
By knowing what the key data points mean, you can quickly diagnose issues and even prevent future problems.
Whether it’s analyzing fuel trim to improve efficiency or monitoring coolant temperature to avoid overheating, live data is a powerful tool for both everyday drivers and car enthusiasts.
Mastering its use not only saves time and money on repairs but also ensures your vehicle operates at its best.
FAQs
Why would you view freeze frame data?
Freeze frame data provides a snapshot of the vehicle's sensor readings and conditions at the exact moment a diagnostic trouble code (DTC) was triggered. This helps pinpoint what was happening when the issue occurred, making it easier to diagnose intermittent or complex problems.
Which operating mode of the OBD-II system shows current data?
Operating mode 1 of the OBD-II system displays current live data from sensors, allowing users to monitor real-time vehicle performance.
What type of codes are stored in a freeze frame?
Freeze frame data is typically stored when emissions-related diagnostic trouble codes (DTCs), such as P-codes (powertrain), are triggered. These codes are related to engine performance, emissions, and other critical systems.
Is it safe to monitor live data while driving?
Yes, but only if a passenger is observing the tool. Watching the screen while driving can be distracting.
How often should I check live data?
Live data is most useful when diagnosing a symptom. Routine checks can help spot gradual issues like fuel trim drift.
Why do live data values change constantly?
Because sensors update multiple times per second. Small fluctuations are normal — focus on patterns.
How to Test O2 Sensors Using Live Data
Using live data for O2 sensor testing is straightforward:
-
Warm up the engine: Sensors are inactive until the engine reaches operating temperature.
-
Select the O2 sensor on your scanner: Upstream sensors (before catalytic converter) are most important for air-fuel mixture.
-
Observe voltage fluctuations: Narrowband sensors should oscillate rapidly; wideband sensors should show smooth changes.
-
Rev the engine slightly: Voltage should respond immediately to changes in throttle or RPM.
-
Check response times and range: Slow response or a narrow voltage swing indicates a worn or faulty sensor.
Optional advanced test:
-
Introduce a small vacuum leak or extra fuel (only if safe and experienced) and watch if the O2 sensor reacts. A properly functioning sensor will detect the change quickly.
Leave a comment
This site is protected by hCaptcha and the hCaptcha Privacy Policy and Terms of Service apply.